Overview of the SWI Prolog Graphical Debugger
SWI-Prolog and XPCE concentrate on program development by offering an environment that is especially suitable for (rapid) prototyping and debugging. This is supported by the fast incremental SWI-Prolog compiler, the graphical debugger that is capable of debugging compiled code and command-line editor.
Tracing Prolog programs using a traditional 4-port debugger (described in the Overview of the SWI Prolog Command Line Debugger) on a terminal is difficult. Large Prolog terms make the trace hard to read, cause difficulty understanding determinism and backtracking, and make it hard to examine the running clauses. That is why SWI-Prolog provides a source-level, graphical debugger.
The graphical debugger uses the same tracing infrastructure (the enhanced “Byrd 4-Port Box Model”, trace/0, etc) and commands as the command line debugger but puts them into a graphical form that more clearly shows the current state of the program when stopped. The command-line debugger is good for seeing the history of the program but the graphical debugger is better at seeing the current state.
Graphical Debugger Window
The graphical debugger requires that XPCE is installed (the default with the standard SWI-Prolog release packages). It is enabled and disabled using the guitracer/0 and noguitracer/0 predicates but won’t launch until your program actually begins generating traces. This is accomplished using any of the normal command-line tracing predicates described in the Command-Line Debugger documentation:
trace/0 |
Start tracing immediately |
spy/1 |
Start tracing when a predicate is evaluated |
set_breakpoint/4 |
Start tracing when a particular usage of a predicate is evaluated. Note that the editor (described below) makes setting these much easier. |
gtrace/0 and gspy/1 are shortcuts to turn on the graphical debugger and begin tracing with a single command. Like trace/0, gtrace/0 can be called from anywhere in a program to start debugging at a specific location.
?- gspy(dubious_predicate_deep_in_program/1).
% The graphical front-end will be used for subsequent tracing
Spy point on dubious_predicate_deep_in_program/1
true.

[debug] ?- top_level_program_predicate.
The source-level debugger is also the tool of choice for debugging threads. This is supported by means of tspy/1, tdebug/0 and tnodebug/0. See also the web-server debugging hints and the debugging threads documentation.
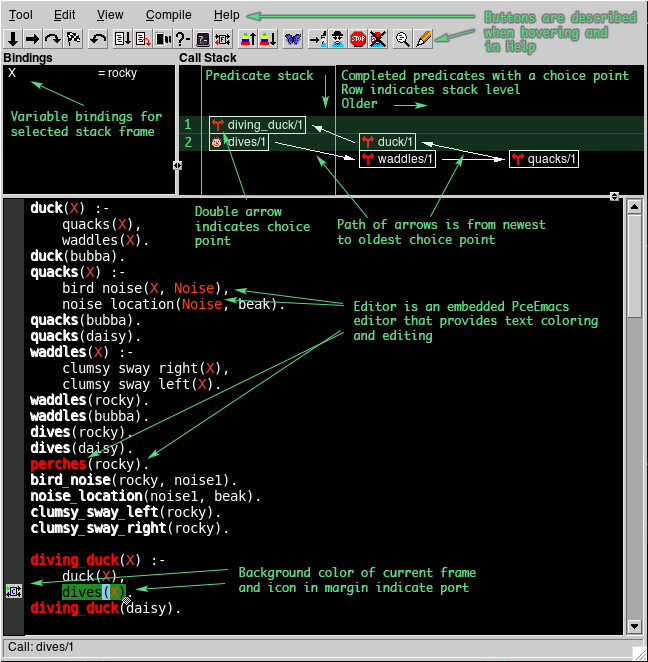
Here is a quick reference to the graphical debugger window that appears. Green text is there for description and not part of the debugger. More detail on each part is below:
Source Code Pane
The graphical debugger follows the Prolog trace mode (trace/0) traces by highlighting the predicate being traced in the source code pane at the bottom of the window. If the clause is asserted, it is shown in a window displaying the decompiled predicate. The predicate’s background color is changed to indicate which of the ports has been traced: call, exit (green) , fail (red), redo (yellow), blue (unify), exception (magenta).
Note that the graphical debugger will become unresponsive when the Prolog console is waiting for a keystroke (i.e. after an answer is returned). Pressing
;will continue tracing and wake up the debugger.
The source code pane is actually an embedded PceEmacs editor in read-only mode. Its behavior closely mimics Richard Stallman’s GNU-Emacs commands, adding features from modern window-based editors to make it more acceptable for beginners. For example, it provides automatic color coding of the original source, editing, autocomplete and many other features as described in the PceEmacs documentation.
Tip: Once you have reproduced a bad state, you can “hot fix” it while it is running using the features of PceEmacs:
- Notice the output is incorrect (failure, wrong answer, success while failure was expected, etc)
- Use the ‘e’ command to switch to write mode and edit the code to fix it
- Save using ^x^s and compile using ^c^b (compile buffer)
- Use the ‘r’ command to retry and test again (commands are described in more detail below).
This strategy for hot-fixing is invaluable for debugging and fixing issues in a program state that takes a long time or lots of user interaction to reproduce.
Clicking on any colored text fragment will show information about it at the bottom of the window. For example, in the code above, both perches/1 and diving_duck/1 are red, indicating that they are not called by anything in the program. Clicking on them will show that there are zero callers on the bottom of the window.
Call Stack Pane
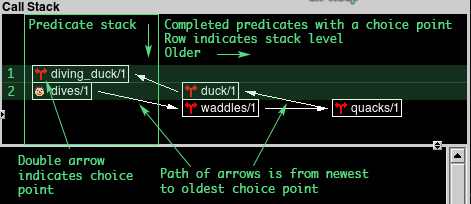
The call stack pane not only provides the call stack, but also the choice point chain. The latter is notably useful to detect (undesired) non-determinism. The leftmost column represents the current stack and grows downward. An icon on each predicate indicates its type:
 |
built-in |
 |
deterministic |
 |
foreign |
 |
meta |
 |
non-deterministic (choice point) |
 |
undefined |
 |
user |
Once a clause on the stack is successfully resolved it is removed from the stack. However, if it still has choice points, it is pushed rightwards into the right section of the pane, potentially pushing others at that level even farther right. This allows visualizing all open choice points at any point in the program execution even if they are no longer on the stack.
Backtracking occurs by the engine executing a redo to the open choice points, newest first, until there are no more. The call stack pane illustrates the order in which this will happen by drawing a path of white arrows from the bottom of the stack to each choice point, newest to oldest.
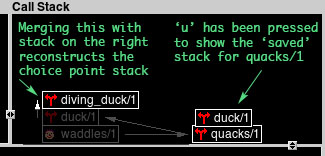
Clicking on a choice point and pressing u multiple times will show the portion of the call stack that is “saved” by the choice point. Because the choice points are displayed at the level of the stack they were created on, this allows for reconstructing what the stack will look like when a redo happens to that choice point:
Tip: The right side of the call stack pane makes it easier to find unwanted non-determinism, for example, if you are trying to write deterministic, last-call optimized code:
- Set a breakpoint at a point in the program where you wanted no open choice points OR use
gspy/1on the predicate that is suspect- Run the program
- When the breakpoint or spy point is hit, use the
s(skip) command to jump to the end of the predicate- Observe the right side to see the open choice points
- Use the
ucommand to reconstruct the stack as above and see how the choice point was created
Note 1: The stack area only shows a small number of frames at a time and hides the top of the stack when this number has been exceeded.
Note 2: The choice point area removes extra blank rows if a choice point frame level is larger than the call stack currently shows. This makes it a bit harder to use the trick above to reconstruct the stack for those predicates.
Bindings Pane
The bindings window displays the binding of the local variables of the selected frame (frames can be selected by clicking the in the stack area of the call stack pane). Variables are indicated by their true name. A concise display, clearly indicating which variables share the same value and removing unbound variables, is provided. Double clicking in the Bindings window will show the binding in a dedicated window, which is useful for analysing complicated terms.
Commands
There are two ways for entering debugger commands: using the toolbar-buttons or using the keyboard from the trace-window. The key-bindings are very similar to the command line debugger. They are listed below in the order of the buttons:

| Into | i | show unify port |
| Creep | c | Continue execution, stop at next port. (Also return, space). |
| Skip | s | Continue execution, stop at the next port of this goal (thus skipping all calls to children of this goal). |
| Finish | f | Run until exit or fail of selected goal |
| Retry | r | Undo all actions (except for database and I/O actions) back to the call port of the current goal and resume execution at the call port. |
| No debug | n | Continue execution in ‘no debug’ mode. |
| Abort | a | Abort Prolog execution (see abort/0). |
| Interrupt | t | Begin tracing (thus interrupting the program) |
| Break | b | Enter a Prolog break environment in debugged thread (see break/0). |
| Break | B | Enter a Prolog break environment in new thread. |
| Fail | F | Force current goal to fail |
| Parent (up) | u | Select parent frame (also arrow-up) |
| Child (down) | d | Select child frame (also arrow-down) |
| Browse Program Structure | [none] | Bring up the Prolog Navigator |
| Leap | l | Continue execution, stop at next spy point. |
| Spy | + | Edit spy points in spy point editor window (see below) |
| Stop | ! | Set breakpoint at current location of caret |
| Delete | - | Remove breakpoint or spy point |
| Variable Details | v | Show variable details |
| Edit | e | Enter edit mode |
Edit Spy Points Window
This window can be seen by choosing Debug/Edit Spy Points... from the Prolog console menu, or by choosing Edit/Breakpoints... or giving the spy (+) command from the graphical debugger:
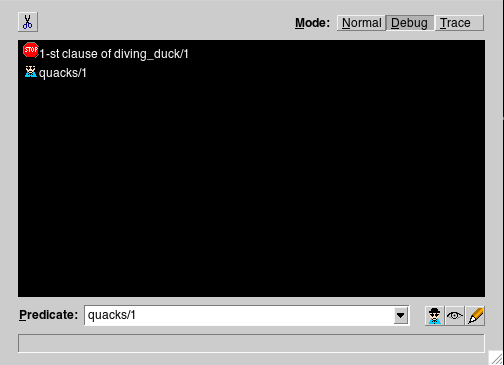
The spy points window shows a list of all spy points and breakpoints that have been set in the program, whether or not they were set in the graphical debugger. Spy points and breakpoints are the same for the command line and graphical debugger and stay set when switching between them. However they were created, they can be deleted by selecting them in the list and choosing the delete button in the upper left corner.
Spy points can be created by typing a predicate name such as quacks/1 into the text box at the bottom of the window and pressing the spy point button on the right or using the command line debugger command spy/1 in the console.
Breakpoints can be created by using the “Stop” command or toolbar button in the graphical debugger or using the set_breakpoint/4 and set_breakpoint/5 commands in the console. They cannot be created here.
Trace points can also be set in this window by entering the predicate in the text box and pressing the trace point button on the right. Note that trace points do not interact with the graphical debugger and are explained more in the Overview of the SWI Prolog Command Line Debugger.
The mode buttons in the upper right are shortcuts for setting the engine in Trace and Debug mode.
Debugging Exceptions
Exceptions in Prolog
(Note: This description of exceptions is originally from this excellent write-up)
Before describing the Edit Exceptions Window, it is important to understand some background on how exceptions work in Prolog: Code throws an exception using the throw/1 term and the exception itself can be any valid Prolog term. However, SWI-Prolog built-in predicates throw ISO standard exception terms unless there is not an appropriate one. ISO standard exception terms must be of the form error(Formal, Context):
Formalis the formal description of the error, specifying the error class and error context information. It may be an atom or a compound term of arity 1,2 or 3. The ISO Standard lists the admissible Formal terms in chapter 7.12.2 pp. 62-63 (“Error classification”).Context, if not a fresh variable, gives additional context to aid in debugging or to allow error-handling routines to decide what to do next. The structure of Context is left unspecified by the ISO Standard but is generally of the formcontext(Name/Arity, Message), whereName/Arityis the predicate indicator of the built-in predicate that raises the error, andMessageprovides an additional description of the error.
Any part of this structure may be a fresh variable if no appropriate information exists.
The Edit Exceptions Window
This window can be seen by choosing Debug/Edit Exceptions... from the Prolog console menu, or by choosing Edit/Exceptions... from the graphical debugger:
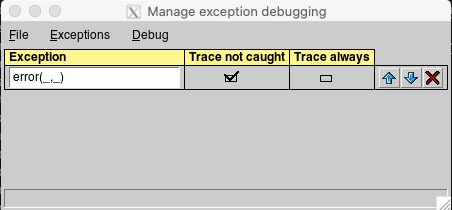
It allows for specifying what to do when an exception is thrown When an exception is thrown, Prolog calls a hook (prolog_exception_hook/4). This hook attempts to unify that term, top down, with each row in the Exceptions Window. If a row unifies
When exceptions happen they automatically get added to the end